
Introduction:
In this post, I’ll start explaining the basics of GDB usage for executing Buffer Overflow attacks on x64 Linux operating system along with some essential tools and debugging techniques.
So what is Buffer Overflow?
A good idea would be by separating the keywords and understand what each of them means in terms of computer science (the standard) and then dive into details.
Buffer: or data buffer is a place in the physical memory (RAM) used temporary in order to store some sort of “data” while it is being moved from one place to another. Typically, the data is stored in a buffer as it is retrieved from an input device or just before it is sent to an output “Standard Output”
Overflow: Is when we put more data or “strings” within a place of memory that has limited length of data storage, for instance, if we have a small program that takes the name of the user and then prints “Hello USER” we can imagine that the “USER” is a variable that has let’s say a length of 10 characters, and when we put more than 10 characters like “AAAAAAAAAAA” we’ll overflow the length of the
Let’s start with a basic BOF example on linux system!
Here’s an example about a vulnerable application in C programming language that takes input from the user and copy it into the memory user “strcpy” function.
As we can see that the user can pass the text to the application and in “Line 3” the string copy will be made and in line 3 we’ll print what the user have typed.
//bof.c
#include <stdio.h>
#include <string.h>

int main(int argc, char* argv[]) {
        /* [1] */ char buf[256];
        /* [2] */ strcpy(buf,argv[1]);
        /* [3] */ printf("Input:%s\n",buf);
        return 0;
}
let’s now compile the application using “GCC” compiler and run the application

As we can see we passed the string “hello” to our application and we got the output of “Input:hello”
Now let’s start debugging the application with a handy tool called “gdb” to see how we can analyze this application
First we load the bof application into the debugger “gdb” using “gdb bof”
Then we can disassemble the “main” function by typing “disassemble main
root@kali:~/bof# gdb bof
GNU gdb (Debian 8.2.1-1) 8.2.1
Copyright (C) 2018 Free Software Foundation, Inc.
License GPLv3+: GNU GPL version 3 or later <http://gnu.org/licenses/gpl.html>
This is free software: you are free to change and redistribute it.
There is NO WARRANTY, to the extent permitted by law.
Type "show copying" and "show warranty" for details.
This GDB was configured as "x86_64-linux-gnu".
Type "show configuration" for configuration details.
For bug reporting instructions, please see:
<http://www.gnu.org/software/gdb/bugs/>.
Find the GDB manual and other documentation resources online at:
    <http://www.gnu.org/software/gdb/documentation/>.

For help, type "help".
Type "apropos word" to search for commands related to "word"...
Reading symbols from bof...(no debugging symbols found)...done.
(gdb) disassemble main
Dump of assembler code for function main:
   0x0000000000001145 <+0>:	push   %rbp
   0x0000000000001146 <+1>:	mov    %rsp,%rbp
   0x0000000000001149 <+4>:	sub    $0x110,%rsp
   0x0000000000001150 <+11>:	mov    %edi,-0x104(%rbp)
   0x0000000000001156 <+17>:	mov    %rsi,-0x110(%rbp)
   0x000000000000115d <+24>:	mov    -0x110(%rbp),%rax
   0x0000000000001164 <+31>:	add    $0x8,%rax
   0x0000000000001168 <+35>:	mov    (%rax),%rdx
   0x000000000000116b <+38>:	lea    -0x100(%rbp),%rax
   0x0000000000001172 <+45>:	mov    %rdx,%rsi
   0x0000000000001175 <+48>:	mov    %rax,%rdi
   0x0000000000001178 <+51>:	callq  0x1030 <strcpy@plt> .  //Here's the strcopy function
   0x000000000000117d <+56>:	lea    -0x100(%rbp),%rax
   0x0000000000001184 <+63>:	mov    %rax,%rsi
   0x0000000000001187 <+66>:	lea    0xe76(%rip),%rdi        # 0x2004
   0x000000000000118e <+73>:	mov    $0x0,%eax
   0x0000000000001193 <+78>:	callq  0x1040 <printf@plt> . //Here's the print
   0x0000000000001198 <+83>:	mov    $0x0,%eax
   0x000000000000119d <+88>:	leaveq
   0x000000000000119e <+89>:	retq
End of assembler dump.
(gdb)
Notice the address of “0x0000000000001178” where “callq 0x1030 <strcpy@ptl> ” where the strcpy function will be executed!
Now let’s run the application within “gdb” with a very long inputs using python
(gdb) r `python -c 'print "A"*300'`
Starting program: /root/bof/bof `python -c 'print "A"*300'`
Input:AAAAAAAAAAAAAAAAAAAAAAAAAAAAAAAAAAAAAAAAAAAAAAAAAAAAAAAAAAAAAAAAAAAAAAAAAAAAAAAAAAAAAAAAAAAAAAAAAAAAAAAAAAAAAAAAAAAAAAAAAAAAAAAAAAAAAAAAAAAAAAAAAAAAAAAAAAAAAAAAAAAAAAAAAAAAAAAAAAAAAAAAAAAAAAAAAAAAAAAAAAAAAAAAAAAAAAAAAAAAAAAAAAAAAAAAAAAAAAAAAAAAAAAAAAAAAAAAAAAAAAAAAAAAAAAAAAAAAAAAAAAAAAAAAAAAAAAAAAAA

Program received signal SIGSEGV, Segmentation fault.
0x000055555555519e in main ()
As we can see in the output above the application have been crashed and we got the message of “Program received signal SIGSEGV, Segmentation fault.”
As we are working on Linux 64 bit operating system, we need to print out the information in the CPU registers to see what values they have, this is can be done by using the command “info registers”
(gdb) info registers
rax            0x0                 0
rbx            0x0                 0
rcx            0x0                 0
rdx            0x7ffff7fa88c0      140737353779392
rsi            0x555555559260      93824992252512
rdi            0x0                 0
rbp            0x4141414141414141  0x4141414141414141  // Notice the rbp have been overwritten
rsp            0x7fffffffe088      0x7fffffffe088
r8             0xffffffffffffffe6  -26
r9             0x7ffff7f65e80      140737353506432
r10            0x0                 0
r11            0x246               582
r12            0x555555555060      93824992235616
r13            0x7fffffffe160      140737488347488
r14            0x0                 0
r15            0x0                 0
rip            0x55555555519e      0x55555555519e <main+89> .
eflags         0x10202             [ IF RF ]
cs             0x33                51
ss             0x2b                43
ds             0x0                 0
es             0x0                 0
fs             0x0                 0
gs             0x0                 0
And in case we want to print only a value of a
Let’s print the values in the rbp register
(gdb) info registers rbp
rbp            0x4141414141414141  0x4141414141414141
(gdb)
Notice that
In order to develop our exploit let’s take notes about two important registers and their address “rbp” and “rsp”
(gdb) x $rsp
0x7fffffffe098:	0x41414141
(gdb) x $rbp
0x4141414141414141:	Cannot access memory at address 0x4141414141414141
(gdb)
Cool, now that we have the address of “rsp” and “rbp” let’s take a look at our stack
(gdb) x/120x $rsp //print the address in hex of the stack of 120 address this will generate 4 columns 30 line in each
0x7fffffffe098:	0x41414141	0x42424242	0x00000000	0x00000000
0x7fffffffe0a8:	0xffffe178	0x00007fff	0x00040000	0x00000002
0x7fffffffe0b8:	0x55555145	0x00005555	0x00000000	0x00000000
0x7fffffffe0c8:	0x89c2c668	0xa3e4198e	0x55555060	0x00005555
0x7fffffffe0d8:	0xffffe170	0x00007fff	0x00000000	0x00000000
0x7fffffffe0e8:	0x00000000	0x00000000	0xebc2c668	0xf6b14cdb
0x7fffffffe0f8:	0xca24c668	0xf6b15ce5	0x00000000	0x00000000
0x7fffffffe108:	0x00000000	0x00000000	0x00000000	0x00000000
0x7fffffffe118:	0xffffe190	0x00007fff	0xf7ffe190	0x00007fff
0x7fffffffe128:	0xf7fe4496	0x00007fff	0x00000000	0x00000000
0x7fffffffe138:	0x00000000	0x00000000	0x55555060	0x00005555
0x7fffffffe148:	0xffffe170	0x00007fff	0x00000000	0x00000000
0x7fffffffe158:	0x5555508a	0x00005555	0xffffe168	0x00007fff
0x7fffffffe168:	0x0000001c	0x00000000	0x00000002	0x00000000
0x7fffffffe178:	0xffffe46e	0x00007fff	0xffffe47c	0x00007fff
0x7fffffffe188:	0x00000000	0x00000000	0xffffe58d	0x00007fff
0x7fffffffe198:	0xffffe59d	0x00007fff	0xffffe5eb	0x00007fff
0x7fffffffe1a8:	0xffffe5fe	0x00007fff	0xffffe612	0x00007fff
0x7fffffffe1b8:	0xffffe629	0x00007fff	0xffffe655	0x00007fff
0x7fffffffe1c8:	0xffffe67b	0x00007fff	0xffffe691	0x00007fff
0x7fffffffe1d8:	0xffffe6a4	0x00007fff	0xffffe6c0	0x00007fff
0x7fffffffe1e8:	0xffffe6cf	0x00007fff	0xffffe6dd	0x00007fff
0x7fffffffe1f8:	0xffffe6ea	0x00007fff	0xffffe704	0x00007fff
0x7fffffffe208:	0xffffe719	0x00007fff	0xffffe74a	0x00007fff
0x7fffffffe218:	0xffffe759	0x00007fff	0xffffe77f	0x00007fff
0x7fffffffe228:	0xffffe7a0	0x00007fff	0xffffe7ad	0x00007fff
0x7fffffffe238:	0xffffe7b6	0x00007fff	0xffffe7cb	0x00007fff
0x7fffffffe248:	0xffffe7d6	0x00007fff	0xffffe7e4	0x00007fff
0x7fffffffe258:	0xffffe7f5	0x00007fff	0xffffedd7	0x00007fff
0x7fffffffe268:	0xffffedf1	0x00007fff	0xffffedfd	0x00007fff
Ok, now we know how to view the stack and how to . print the registers values, the mission right now it’s generate a unique pattern and override the registers again and then the the memory address, so let’s meet “pattern_create.rb”.
Generating a unique pattern of 300 characters
root@kali:~/bof# /usr/share/metasploit-framework/tools/exploit/pattern_create.rb -l 300
Aa0Aa1Aa2Aa3Aa4Aa5Aa6Aa7Aa8Aa9Ab0Ab1Ab2Ab3Ab4Ab5Ab6Ab7Ab8Ab9Ac0Ac1Ac2Ac3Ac4Ac5Ac6Ac7Ac8Ac9Ad0Ad1Ad2Ad3Ad4Ad5Ad6Ad7Ad8Ad9Ae0Ae1Ae2Ae3Ae4Ae5Ae6Ae7Ae8Ae9Af0Af1Af2Af3Af4Af5Af6Af7Af8Af9Ag0Ag1Ag2Ag3Ag4Ag5Ag6Ag7Ag8Ag9Ah0Ah1Ah2Ah3Ah4Ah5Ah6Ah7Ah8Ah9Ai0Ai1Ai2Ai3Ai4Ai5Ai6Ai7Ai8Ai9Aj0Aj1Aj2Aj3Aj4Aj5Aj6Aj7Aj8Aj9
root@kali:~/bof#
Now that we have our pattern, let’s execute it again using gdb. using run “pattern”
(gdb) run Aa0Aa1Aa2Aa3Aa4Aa5Aa6Aa7Aa8Aa9Ab0Ab1Ab2Ab3Ab4Ab5Ab6Ab7Ab8Ab9Ac0Ac1Ac2Ac3Ac4Ac5Ac6Ac7Ac8Ac9Ad0Ad1Ad2Ad3Ad4Ad5Ad6Ad7Ad8Ad9Ae0Ae1Ae2Ae3Ae4Ae5Ae6Ae7Ae8Ae9Af0Af1Af2Af3Af4Af5Af6Af7Af8Af9Ag0Ag1Ag2Ag3Ag4Ag5Ag6Ag7Ag8Ag9Ah0Ah1Ah2Ah3Ah4Ah5Ah6Ah7Ah8Ah9Ai0Ai1Ai2Ai3Ai4Ai5Ai6Ai7Ai8Ai9Aj0Aj1Aj2Aj3Aj4Aj5Aj6Aj7Aj8Aj9
Starting program: /root/bof/bof Aa0Aa1Aa2Aa3Aa4Aa5Aa6Aa7Aa8Aa9Ab0Ab1Ab2Ab3Ab4Ab5Ab6Ab7Ab8Ab9Ac0Ac1Ac2Ac3Ac4Ac5Ac6Ac7Ac8Ac9Ad0Ad1Ad2Ad3Ad4Ad5Ad6Ad7Ad8Ad9Ae0Ae1Ae2Ae3Ae4Ae5Ae6Ae7Ae8Ae9Af0Af1Af2Af3Af4Af5Af6Af7Af8Af9Ag0Ag1Ag2Ag3Ag4Ag5Ag6Ag7Ag8Ag9Ah0Ah1Ah2Ah3Ah4Ah5Ah6Ah7Ah8Ah9Ai0Ai1Ai2Ai3Ai4Ai5Ai6Ai7Ai8Ai9Aj0Aj1Aj2Aj3Aj4Aj5Aj6Aj7Aj8Aj9
Input:Aa0Aa1Aa2Aa3Aa4Aa5Aa6Aa7Aa8Aa9Ab0Ab1Ab2Ab3Ab4Ab5Ab6Ab7Ab8Ab9Ac0Ac1Ac2Ac3Ac4Ac5Ac6Ac7Ac8Ac9Ad0Ad1Ad2Ad3Ad4Ad5Ad6Ad7Ad8Ad9Ae0Ae1Ae2Ae3Ae4Ae5Ae6Ae7Ae8Ae9Af0Af1Af2Af3Af4Af5Af6Af7Af8Af9Ag0Ag1Ag2Ag3Ag4Ag5Ag6Ag7Ag8Ag9Ah0Ah1Ah2Ah3Ah4Ah5Ah6Ah7Ah8Ah9Ai0Ai1Ai2Ai3Ai4Ai5Ai6Ai7Ai8Ai9Aj0Aj1Aj2Aj3Aj4Aj5Aj6Aj7Aj8Aj9

Program received signal SIGSEGV, Segmentation fault.
0x000055555555519e in main ()
Again let’s print the value inside $rbp register
(gdb) x $rbp
0x3769413669413569:	Cannot access memory at address 0x3769413669413569
(gdb)
Cool, let’s covert the value of the
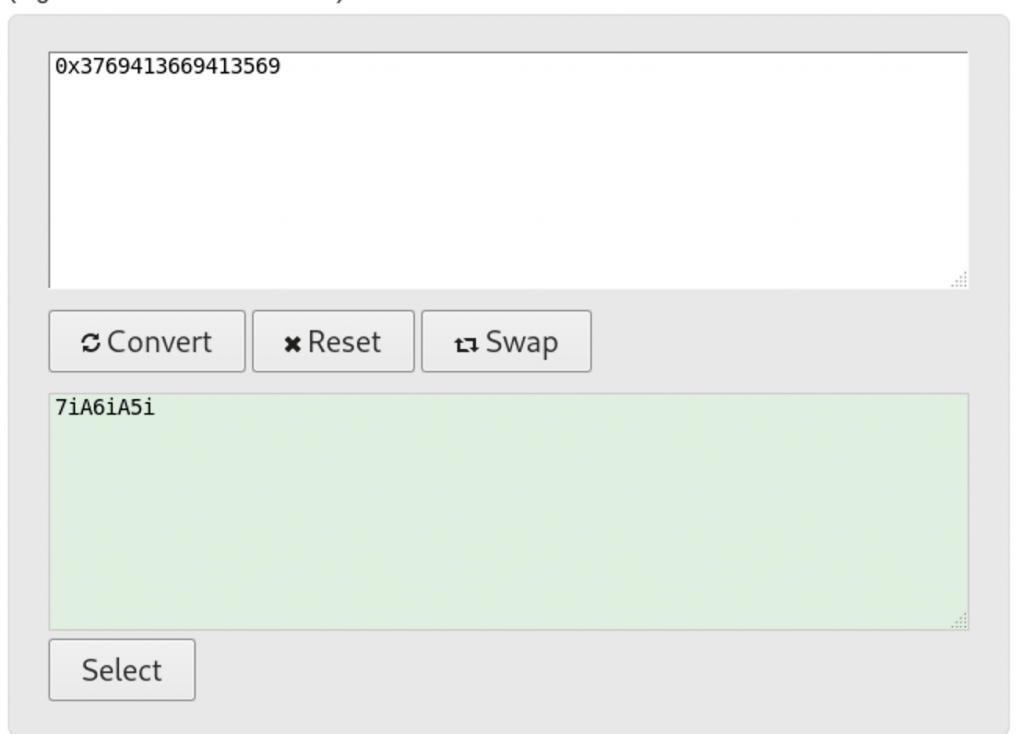
Now because we’re working on x68 linux operating system we have to reverse the order of the characters we found after converting the pattern.
Notice: if you want to check out whether your system is little endian or big endian, you can use this command
root@kali:~/bof# echo -n I | od -to2 | head -n1 | cut -f2 -d" " | cut -c6
1 // means i am running little endian
After reversing the ascii that we found it will become “i5Ai6Ai7”
As we can see the value in the $rbp register is “7iA6 iA5i”, let’s now meet “pattern_offset.rb” which will help us to find the numeric representation for this pattern.

As expected, the offset is 256
We have seen how to debug and find offsets along with basic usage of GDB, in next articles we’ll dive into the exploitation process and more about shellcode development.
Leave a Reply